Analysis of Financial and Economic Indicators
GRI 2-6
Analysis of actual income and expense indicators for 2025, KZT million
| 2025 plan | 2025 actual | Deviation | Main reasons for deviations | |
|---|---|---|---|---|
| Consolidated income | 394,189 | 415,806 | 105 % | |
| Income from core activities | 383,465 | 397,737 | 104 % |
Main reasons:
It should be noted that turnover from balancing electricity and imbalances is offset against expense turnover.
|
| Consolidated expenses | 309,801 | 327,528 | 105 % | |
| Cost of sales | 273,670 | 288,064 | 105 % |
Main reasons:
|
| General and administrative expenses | 14,592 | 13,211 | 90 % | Decrease due to savings achieved on current expenses. |
| Selling expenses | 736 | 605 | 82 % | Decrease due to savings achieved on current expenses. |
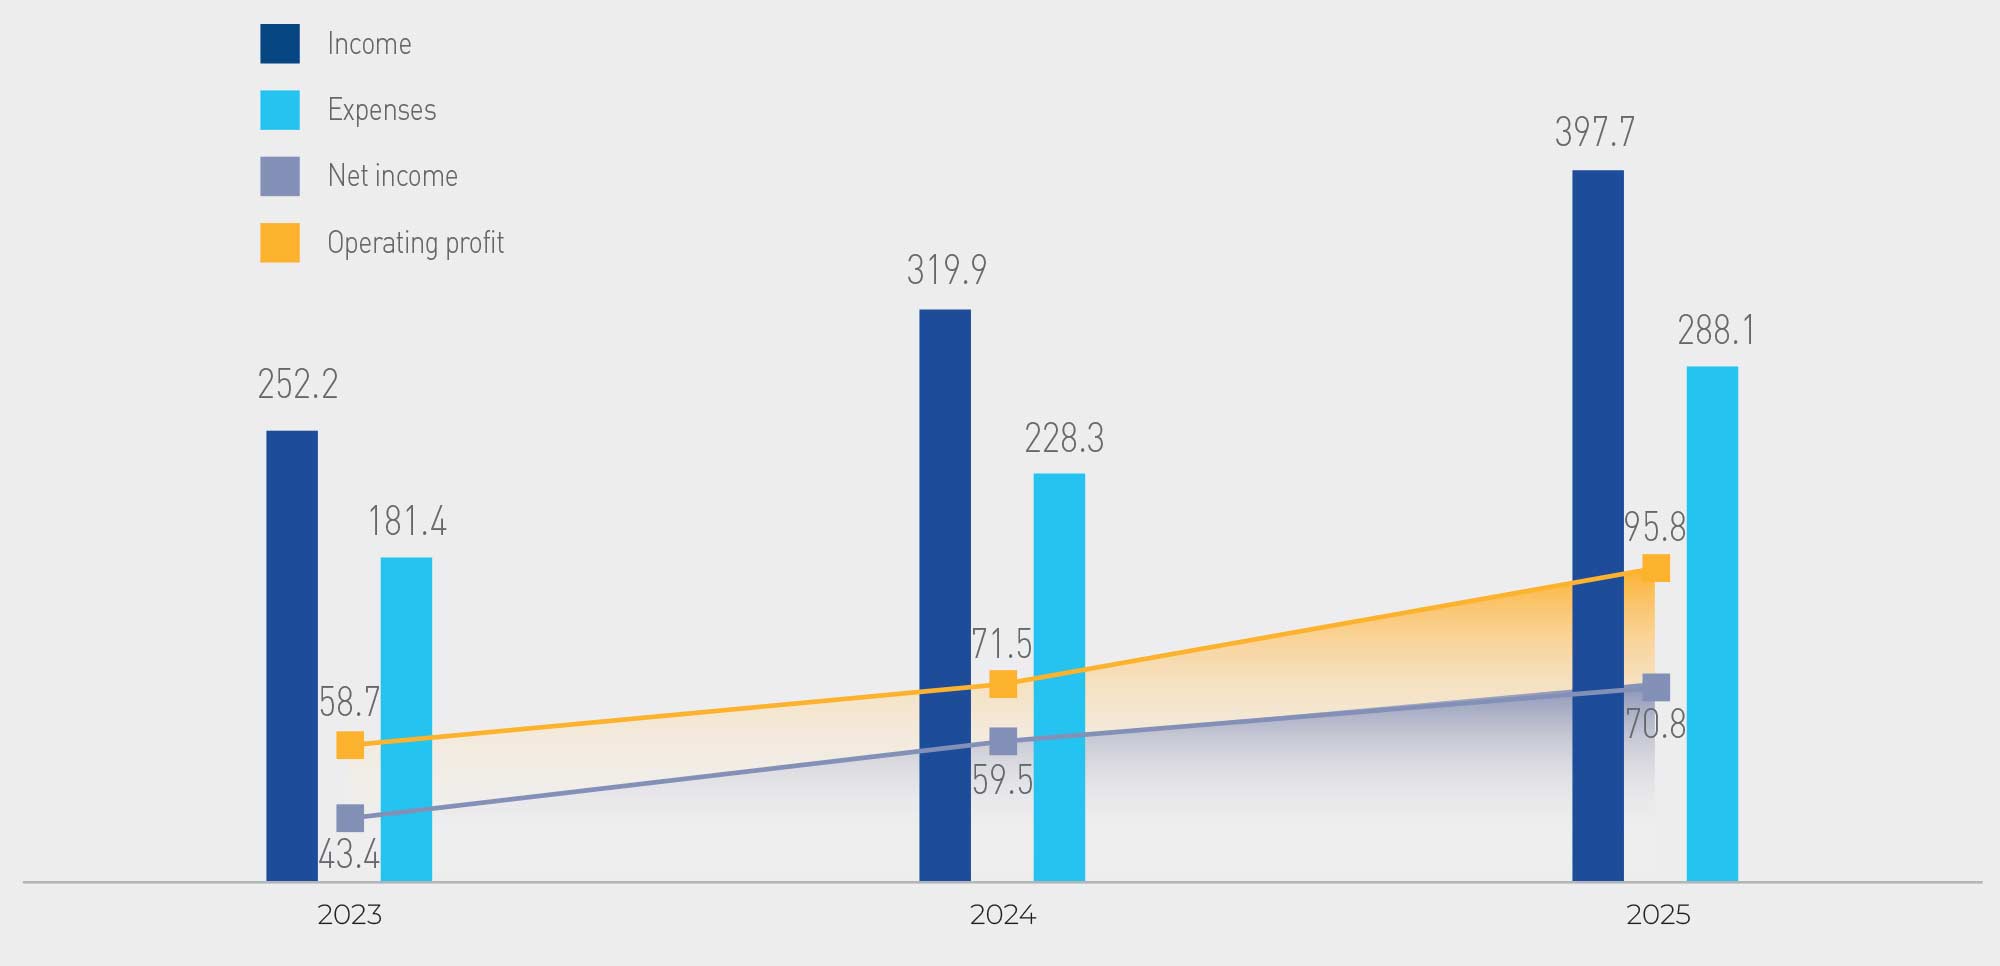
| Operating profit | 94,467 | 95,768 | 101 % |
Analysis of actual income and expense indicators for 2025 against actual indicators for 2024, KZT million
| 2024 actual | 2025 actual | Deviation | Main reasons for deviations | |
|---|---|---|---|---|
| Consolidated income | 338,447 | 415,806 | 123 % | |
| Income from core activities | 319,906 | 397,737 | 124 % |
The increase was mainly due to growth in income from regulated services by KZT 64,123 million as a result of changes in tariffs and volumes of services provided.
At the same time, compared to the same period of the previous year, income from electricity sales operations within the balancing market of the Republic of Kazakhstan increased by KZT 11,135 million. |
| Consolidated expenses | 264,583 | 327,528 | 124 % | |
| Cost of sales | 228,254 | 288,064 | 126 % | Compared to the same period of 2024, cost of sales increased by KZT 59,810 million, mainly due to higher expenses for compensation of losses from balancing electricity due to an increase in the average price from KZT 18.43 to KZT 27.44/kWh, capacity reserve readiness services by KZT 1,130 million, and payroll by KZT 6,102 million as a result of planned measures to improve the level of social stability. |
| General and administrative expenses | 12,538 | 113,211 | 105 % | |
| Selling expenses | 549 | 605 | 110.2 % | Increase as a result of payroll growth. |
| Operating profit | 71,494 | 95,768 | 134 % |
Dynamics of Financial and Economic Indicators, KZT billion
Coefficient Analysis
At the end of 2025, ROACE increased by 1.46 percentage points compared to 2024, including due to an increase in adjusted profit (NOPAT) by KZT 17.9 billion, and a decrease due to an increase in average capital employed (ACE) by KZT 53.7 billion.
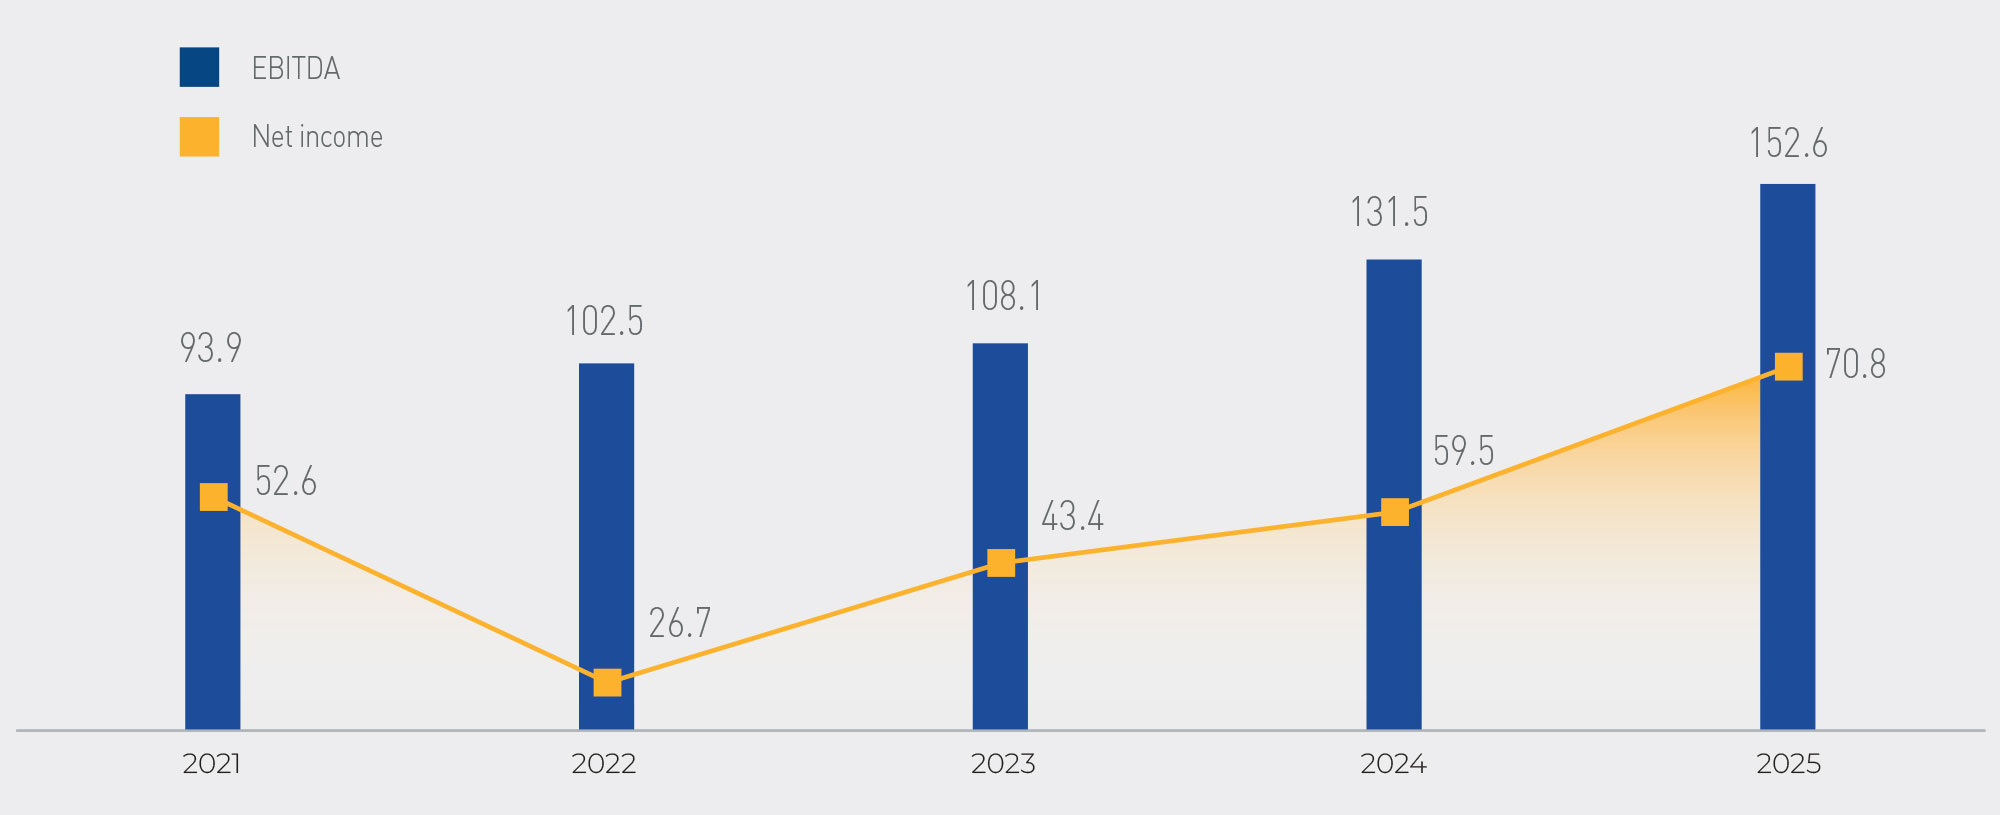
At the end of 2025, EBITDA increased by KZT 21.1 billion compared to 2024. The change in the indicator was affected by:
- changes in volumes and tariffs for regulated services by KZT 64.1 billion;
- an increase in expenses for maintaining capacity reserves in readiness by KZT 1.4 billion as a result of price growth;
- an increase in expenses for compensation of losses from balancing electricity by KZT 28.5 billion as a result of growth in the average electricity purchase price;
- an increase in labour costs, including contributions, by KZT 6.2 billion and other factors.
During 2025, no breaches of financial stability ratios or covenants were recorded.
Economic Value Generated and Distributed
The economic component of KEGOC JSC’s activities is of strategic importance both for the Company itself and for the national economy. The main focus in this area is ensuring sustainable growth and creating long-term value for Shareholders and investors.
The procedures for forming and approving the Action Plan (Business Plan) and budgets, including the capital investment plan for investment projects (construction, reconstruction and modernization of facilities), are governed by the Rules for Development, Approval, Adjustment, Execution and Monitoring of Execution of the Action Plan (Business Plan) and Budgets of KEGOC JSC.
The Action Plan (Business Plan) is developed for a 5-year period on a rolling basis and includes consolidated data of subsidiaries. To implement the Action Plan, the income and expense budget is approved annually. Monitoring of Business Plan execution is carried out by the Board of Directors of KEGOC JSC on a quarterly basis.
GRI 201-1, GRI 201-4
Distribution of Economic Value, KZT million
| Year | 2023 | 2024 | 2025 |
|---|---|---|---|
| Total capitalisation | 849,254.52 | 931,502.5 | 957,755.9 |
| equity capital | 685,719.13 | 769,921.8 | 796,174.6 |
| debt capital | 163,535.39 | 161,580.7 | 161,581.3 |
| Funds received from the state | 0 | 0 | 0 |
| Economic value generated | 263,910.63 | 337,695 | 412,448.9 |
| income from core activities | 252,136.38 | 319,906 | 397,736.71 |
| finance income | 7,576.47 | 11,886.4 | 13,337.46 |
| other income | 4,197.78 | 5,903.3 | 1,374.73 |
| Economic value distributed | 253,879.87 | 322,768.5 | 387,174.5 |
| labour costs | 33,272.86 | 37,980.5 | 48,741.25 |
| taxes and levies paid to the state budget | 21,610.03 | 26,644.8 | 29,769.76 |
| payments to providers of capital | 47,075.04 | 56,872.9 | 65,565.01 |
| charitable and sponsorship assistance | 0 | 1,000.0 | 200.0 |
| expenses for financing political parties and associations * | 0 | 0 | 0 |
| other operating expenses | 148,327.37 | 190,082.4 | 240,822.42 |
| other non-operating expenses | 3,594.57 | 10,187.9 | 2,076.1 |
| Profit after tax for the year from discontinued operations | 0 | 0 | 0 |
| Economic value to be distributed | 10,030.77 | 14,927.2 | 26,203.8 |
* In accordance with the Anti-Fraud and Anti-Corruption Policy, KEGOC JSC does not participate in financing political parties, candidates, political campaigns or other forms of political activity, either directly or through subsidiaries. The Company does not make political contributions or donations and does not engage third-party organizations for lobbying activities. Membership in industry, technical and professional associations is aimed solely at developing standards, sharing experience and improving service quality, and is not related to supporting political positions.
The Company adheres to the principles of transparency, political neutrality and fair business conduct. Since lobbying activities are absent, special programmes to align activities with the goals of the Paris Agreement are not required; however, KEGOC JSC takes climate requirements into account when interacting with industry associations and professional associations.
Balance Analysis
Economic Balance Indicators of KEGOC JSC
| Indicator, KZT million | 2021 | 2022 | 2023 | 2024 | 2025 | 2025/2024 |
|---|---|---|---|---|---|---|
| Non-current assets | 1,019 820 | 873,933 | 881,415 | 960,180 | 1,016 094 | 106 % |
| Current assets | 73,397 | 112,679 | 120,371 | 136,886 | 120,927 | 88 % |
| Total assets | 1,093 217 | 986,612 | 1,001 785 | 1,097 066 | 1,137 021 | 145 % |
| Equity | 737,137 | 653,565 | 685,719 | 769,922 | 796,175 | 103 % |
| Non-current liabilities | 310,397 | 273,570 | 277,540 | 289,230 | 285,840 | 99 % |
| Current liabilities | 45,684 | 59,477 | 38,526 | 37,914 | 55,007 | 145 % |
| Total liabilities | 356,080.5 | 333,047 | 316,066 | 327,144 | 340,847 | 104 % |
| Total equity and liabilities | 1,093 217 | 986,612 | 1,001 785 | 1,097 066 | 1,137 021 | 104 % |
The Company’s assets as of 31 December 2025 amounted to KZT 1,137,021 million, an increase of 4 % compared to 2024.
Non-current assets account for 89.4 % of the balance sheet structure and are mostly represented by property, plant and equipment. At the end of 2025, non-current assets increased by 6 % and amounted to KZT 1,016,094 million.
Current assets account for 10.6 % of the balance sheet. In 2025, they decreased by 12 % (or KZT 15,959 million) and amounted to KZT 120,927 million at year-end. The decrease was due to an increase in other financial assets as a result of coupon bonds of Samruk-Kazyna JSC, as well as cash and cash equivalents at the end of the period.
Equity at the end of 2025 amounted to KZT 796,175 million, an increase of 3 %, or KZT 26,253 million, compared to 2024, formed mainly due to the revaluation of property, plant and equipment carried out in December 2024 and growth in retained earnings. The share of equity in the balance sheet structure was 70 %.
Liabilities at year-end amounted to KZT 340,847 million, an increase of 4 %, or KZT 13,703 million, compared to 2024. Non-current liabilities accounted for 84 % of liabilities and current liabilities for 16 %. The change was due to a decrease in loan liabilities in connection with the scheduled repayment of a loan from the International Bank for Reconstruction and Development, and an increase in deferred income tax liability by KZT 14,057.5 million as a result of the revaluation of property, plant and equipment carried out in December 2024.
Stable financial performance allows the Company to fulfil its obligations to key stakeholders on time and in full:
- payment of salaries to employees and provision of social support;
- payment of dividends to Shareholders;
- implementation of investment projects and improvement of the quality and reliability of NPG operation;
- timely settlements with suppliers;
- payment of taxes.
Profitability Indicators of KEGOC JSC, KZT billion
Indicators of Goal 3 Implementation
| KPI name | 2020 | 2021 | 2022 | 2023 | 2024 | 2025 |
|---|---|---|---|---|---|---|
| actual | actual | actual | actual | actual | actual | |
| TSR (total shareholder return), % | indicator defined in December 2021 | –10.7 | 3.44 | 13.96 | 12.81 | |
| EBITDA, KZT billion | 108.4 | 93.9 | 102.5 | 108.1 | 131.5 | 152.6 |
The actual TSR value was affected by the increase in the Company’s share price in 2025 to KZT 1,555 per share, compared to KZT 1,527 per share in the same period of the previous year, while at year-end the Company paid KZT 161.9 in dividends per share.
The growth of EBITDA is mainly affected by changes in volumes and tariffs for regulated services, as well as changes in the purchase price of electricity from the Single Buyer.